
Products
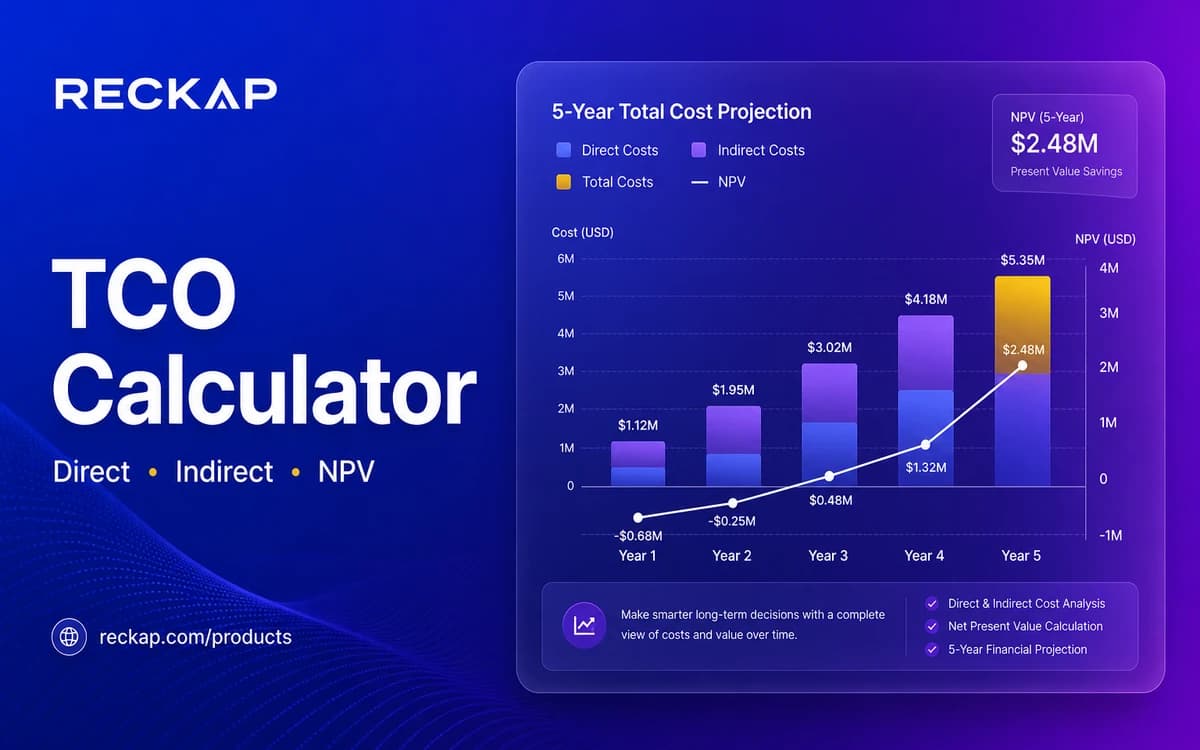
Advanced TCO Calculator
Compare CapEx and OpEx for two IT options with NPV, inflation, and tax - in your browser.
Compare CapEx and OpEx for two IT options with NPV, inflation, and tax - in your browser.
Runs in your browser. Files stay on your device - Reckap does not upload them for this tool.
Advanced TCO calculator
Compare CapEx and OpEx for two options with inflation, discount, and tax. Runs in your browser - nothing is uploaded.
Edit scenario
Assumptions
Cost lines , Option A
CapEx hits year 1 once. OpEx grows with inflation each year. Drag, arrows, or order # to rearrange , max 40 lines.
Option A NPV
$335,454
Option A 5-yr sum
$417,876
Option B NPV
$497,465
NPV delta (B − A)
$162,010
A costs less in present value
Year cash preview
Live totals after inflation and OpEx tax. CapEx in year 1 only.
- Y1
- Y2
- Y3
- Y4
- Y5
Year table , both
| Year | Option A | Option B |
|---|---|---|
| 1 | $99,000 | $153,000 |
| 2 | $76,220 | $111,240 |
| 3 | $78,507 | $114,577 |
| 4 | $80,862 | $118,015 |
| 5 | $83,288 | $121,555 |
Direct / indirect (base, before inflation): $73,000 / $26,000
Planning estimates only - not tax, accounting, or investment advice. Reckap Solutions LLC, Albuquerque, NM.

Reckap Advanced TCO Calculator compares two ownership scenarios with CapEx, OpEx, inflation, discount, and tax. Review NPV and year cash, then export PDF, XLSX, or CSV. Figures stay in your browser.
Model total cost of ownership for two scenarios side by side. Separate CapEx (year-1) from OpEx (annual with inflation), tag direct vs indirect costs, set discount and OpEx tax, then review a live year chart and table. Export PDF, XLSX, or CSV for stakeholders. Presets cover SaaS, on-prem refresh, and cloud migrate starting points. Runs on your device; Reckap does not store your figures. Estimates for planning conversations only - not financial advice.
- Two-scenario CapEx / OpEx compare
- NPV, inflation, discount, OpEx tax
- Live year chart + cost-line grid
- PDF, XLSX, CSV export
- SaaS, on-prem, and cloud presets
Related industries: it operations
How to use
Pick a scenario and lines
Edit Option A or B. Load a SaaS, on-prem, or cloud preset, or add CapEx and OpEx lines. Reorder with drag, arrows, or order numbers.
Set assumptions
Slide horizon, inflation, discount rate, and OpEx tax. Choose currency. Toggle compare to show both scenarios on the chart.
Review and export
Read NPV, year bars, and the year table. Export a PDF summary or an XLSX/CSV workbook for stakeholders.
FAQ
Related tools
More Reckap browser tools in the same lane.



Next step
Ready to talk scope?
Bring the job, the systems you already run, and who owns the handoff. We write the rest.